SIM_parachute
Background
On October 14, 2012, 43-year-old Austrian daredevel Felix Baumgartner broke the world record for the highest-ever skydive after jumping from a balloon at an altitude of 127,852 feet. He reached a top speed of 843.6 mph, spent approximately 4 minutes 19 seconds in free-fall, and landed safely approximately 11 minutes after jumping.
Simulation
The simulation only considers the forces of gravity and drag, and only motion in the vertical. The acceleration of the skydiver is determined by summing the forces of gravity and drag acting on him and then dividing by his mass. His velocity is determined by integrating his acceleration over time, and his altitude by integrating his velocity over time.
Desired outputs are:
- Plot of altitude vs. time.
- Plot of velocity vs. time.
- Time of touchdown.
Gravity
Where:
- m = mass of the skydiver.
- g = acceleration of gravity.
Drag
Where:
- Cd = Coefficient of drag
- ρ = air density
- v = instantaneous velocity
- A = cross-sectional area of the jumper
Air Density and Gravity Data
The table at: http://www.engineeringtoolbox.com/standard-atmosphere-d_604.html provides both gravity (g) and air density (ρ) at various altitudes. From these data we interpolate, to approximate the air density and gravity at specific altitudes.
Parachute Deployment
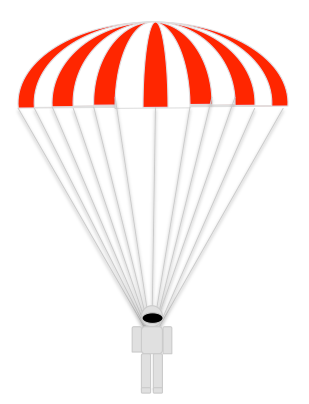
Parachute deployment is modeled, using a Trick event (in input.py) that simply increases the skydiver's
- cross-sectional area (A) and
- coefficient of drag (Cd).
at the specified time.
Felix Baumgartner Jump Scenario
- dyn.groundAltitude = 1000
- dyn.parachutist.altitude = 38969.6 meters
- dyn.parachutist.velocity = 0.0
- dyn.parachutist.area = 0.75
- dyn.parachutist.Cd = 0.75
- dyn.parachutist.mass = 82.0
At 4 minutes and 19 seconds, pop the chute:
- dyn.parachutist.Cd = 1.3
- dyn.parachutist.area = 30.0


